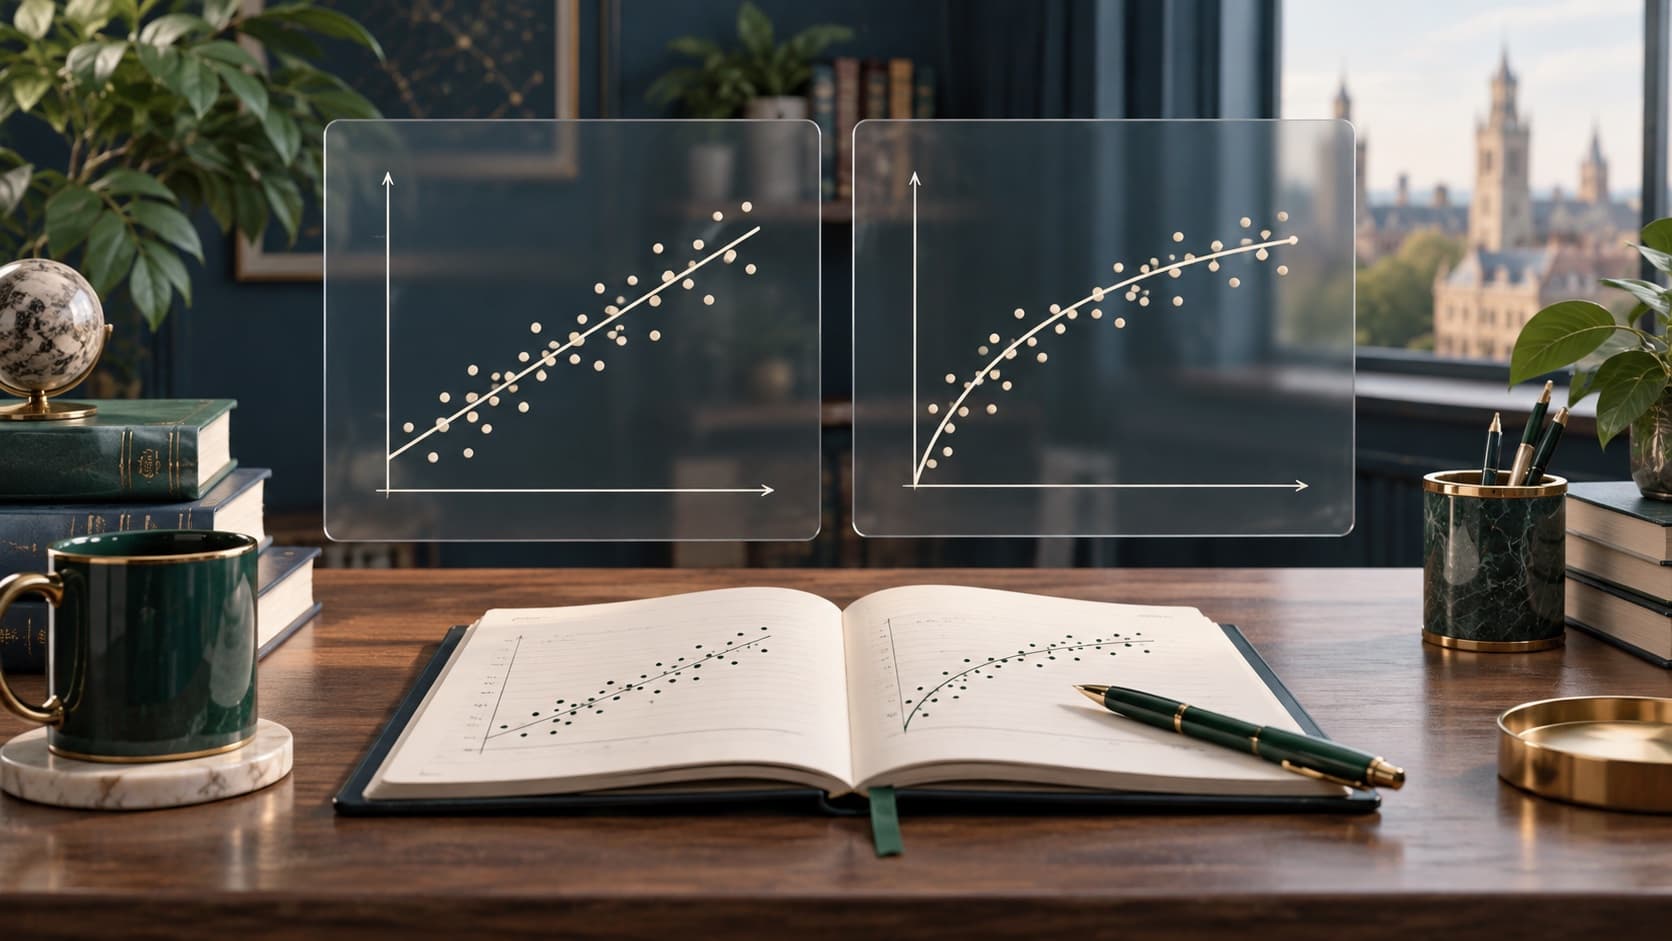
Descriptive statistics in the research chapter: mean, median and standard deviation
The purpose of descriptive statistics is not to fill the table with as many indicators as possible, but to show the typical value, variation and shape of the distribution in a way that corresponds to the scale of the measurement.

Key information
- ✓Choose the dimensions for the scale and the shape of the distribution.
- ✓Interpret the mean along with the measure of variation.
- ✓When decomposing the scales, consider the median and the quarter.
- ✓In the text, describe the pattern, not the entire table.
Amounts and interest
Describe the categorical variables by the number of observations and the percentage. Always give the basis for the percentage and explain the lack of data. The amount can vary from one hundred percent by rounding, but it should be easy to identify.
Average and median
The mean uses all the values, so it's sensitive to extreme observations. The median divides an ordered set in half and is more representative in the random distribution.
Differentiation of data
The standard deviation describes the distribution of results around the mean, whereas the interquartile distribution complements the median. The central value itself can conceal large differences between participants, so the measurement of position and distribution should be analysed together.
Table description in the text
First, identify the most important pattern, then the values you need to document it. Don't write down all the numbers. When comparing groups, mark the descriptive difference, but don't call it statistically significant without a proper test.
Summary
Good descriptive statistics allow a quick understanding of the sample being studied and provide a basis for further analysis. The choice of measurements should be based on the type of data, and the text description should expose the conclusions, not repeat every cell of the table.
Frequently asked questions
Do you always have to give the mean and the standard deviation?
For nominal data, numbers and percentages are appropriate, and for order or strongly conventional data, medians and quarts are often more informative.
Need support with your work?
Describe the topic, scope and deadline. We will review the materials, recommend the right support and prepare a clear quote.